Monitoring the runtime
Using the cli
The omega-ml cli provides the runtime status command to inspect the
status.
# show all active workers
$ om runtime status
{'celery@eowyn': []}

# show active labels, as processed by workers
$ om runtime status labels
{'celery@eowyn': ['default:R']}

# show worker statistics
{'celery@eowyn': {'size': 4,
              'tasks': {'omegaml.tasks.omega_ping': 1,
                        'omegaml.tasks.omega_predict': 7}}}
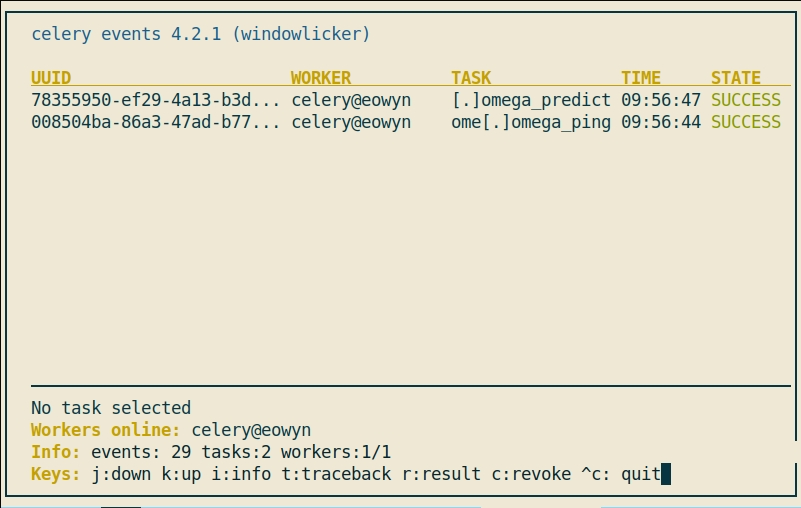
Using the console
The celery events console application will show live events across all workers.
$ om runtime celery events
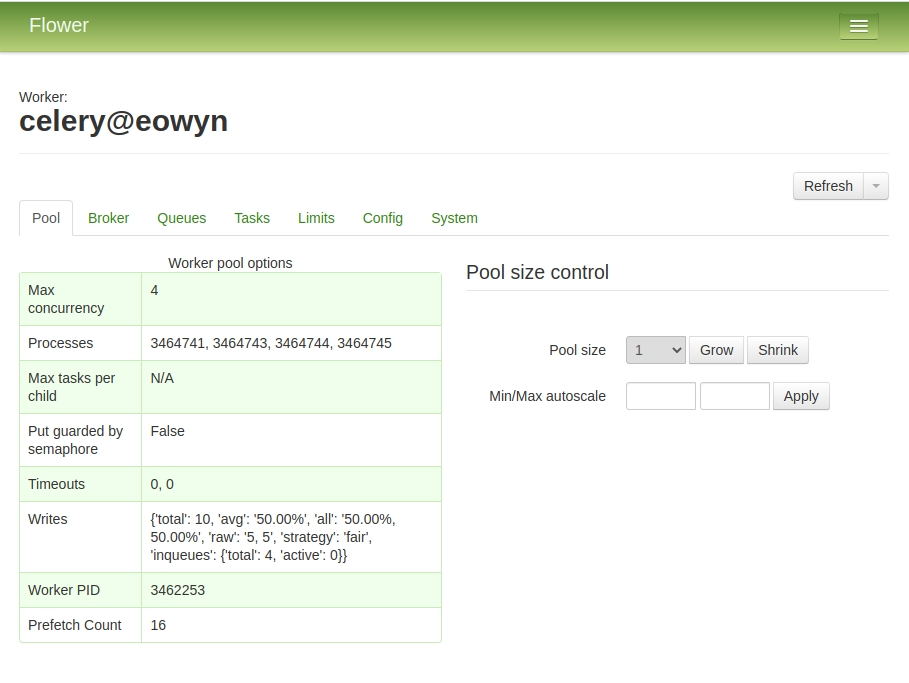
Using a browser
The celery flower web application provides both insights into the currently running tasks as well as history statistics.
$ pip install omegaml flower
$ om runtime celery flower
Using celery commands
Further inspection and control of the omega-ml runtime is provided by
the celery command-line utilities. Most of these commands are directly
available through the om runtime celery command:
$ om runtime celery inspect ping
-> celery@eowyn: OK
           pong
Note that omega-ml ensures proper initialisation of the celery environment. However it is also possible to interact with celery directly. In some instances this may be more convenient.
$ celery -A omegaml.celeryapp inspect ping
-> celery@eowyn: OK
       pong